Bus-to-Person Collisions Safety Advisory 23-1
Overview

On September 19, 2023, FTA issued Safety Advisory 23-
1: Bus-to-Person Collisions to recommend that transit agencies that provide bus service consider mitigation strategies to reduce bus-to-person collisions to help reduce the likelihood and severity of bus collisions with pedestrians, bicyclists and micromobility users.
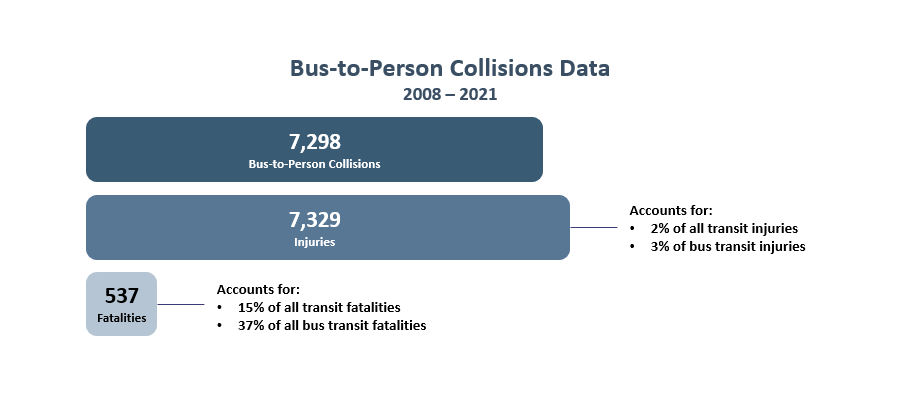
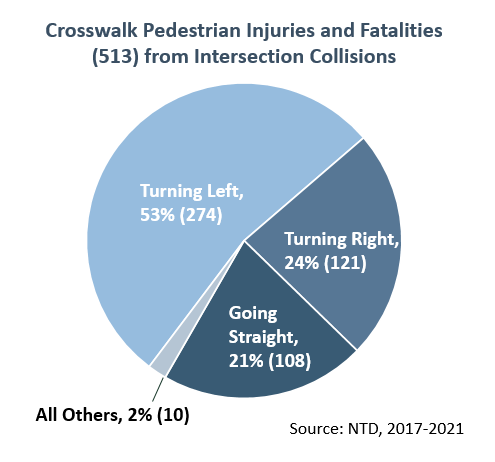
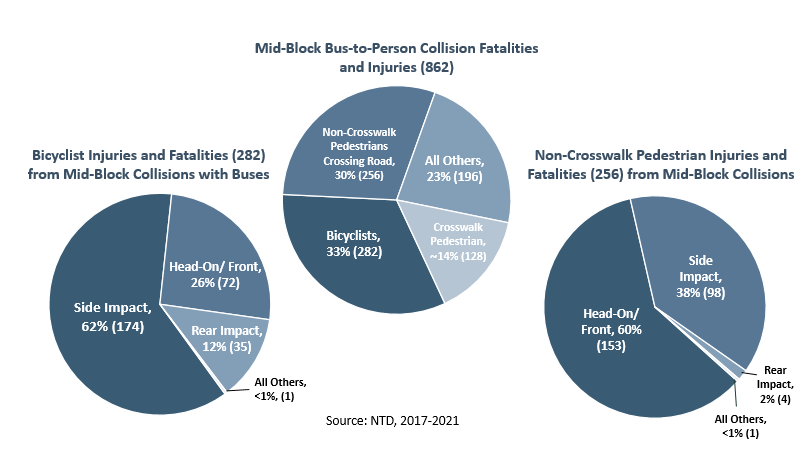
Data from the National Transit Database shows that bus-to-person collisions remain a top safety concern accounting for 15 percent of fatalities from 2008 to 2021, with left turns as a predominant risk focus area.
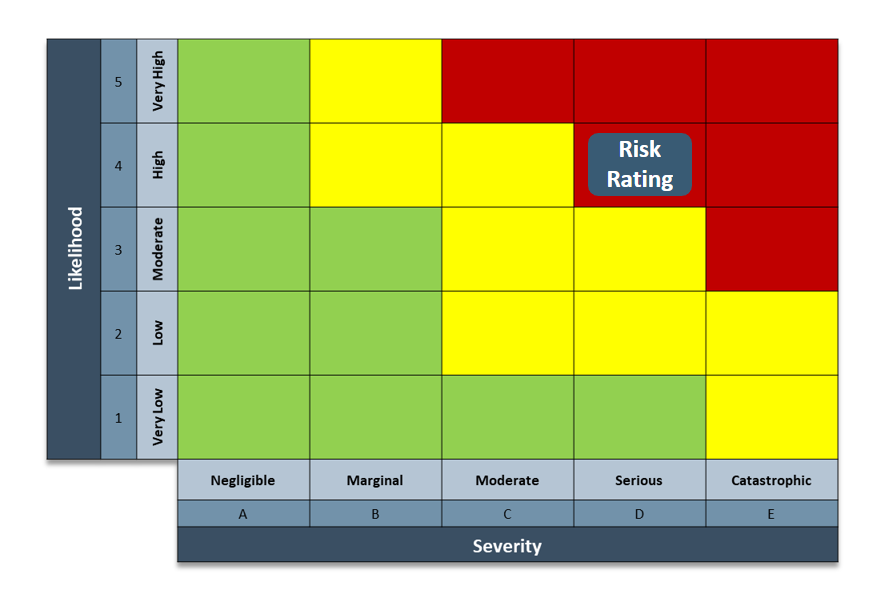
To improve bus safety, bus transit agencies should identify specific hazards that may cause or contribute to bus-to-person collisions, assess the associated safety risk and implement appropriate mitigations to reduce the likelihood and severity of those collisions. At a minimum, agencies should consider the following bus operator vision impairment when conducting their safety risk assessments.
As a part of its safety risk assessment, FTA identified the following hazards that may result in bus-to-persons collisions:
- Bus operator vision impairment due to components of the bus design
- Bus operator vision impairment due to obstructions and activity outside of the bus
- Entry into the bus path by pedestrians, bicyclists and other micromobility users
- Limited space at bus stops and adjacent sidewalks
FTA will roll out resources and engage with the industry on this topic area over the next several years. FTA will post bus-to-person collision resources on this website and send notifications once these resources are available.
For further questions regarding this Safety Advisory, please email FTASystemSafety@dot.gov
What’s New
Webinar
Data from the National Transit Database shows that bus-to-person collisions remain a top safety concern accounting for 15 percent of fatalities from 2008 to 2021. FTA issued Safety Advisory 23-1 on September 19, 2023, recommending transit agencies that provide bus service consider mitigation strategies to reduce bus-to-person collisions. This webinar will review key elements from the Safety Advisory, share resources available to assist transit agencies with safety risk assessments and mitigation implementation pertaining to bus-to-person collisions and will feature a transit agency guest speaker who will share their experience with addressing risks associated with bus-to-person collisions, including mitigation strategies and lessons learned.
FTA Safety Advisory 23-1: Bus-to-Person Collisions
Thursday, October 5, 2023
Presentation | Recording
Safety Risk Management Bus-to-Person Collisions Mitigations